New state budget, by the numbers
Published 11:40 pm Wednesday, August 8, 2018
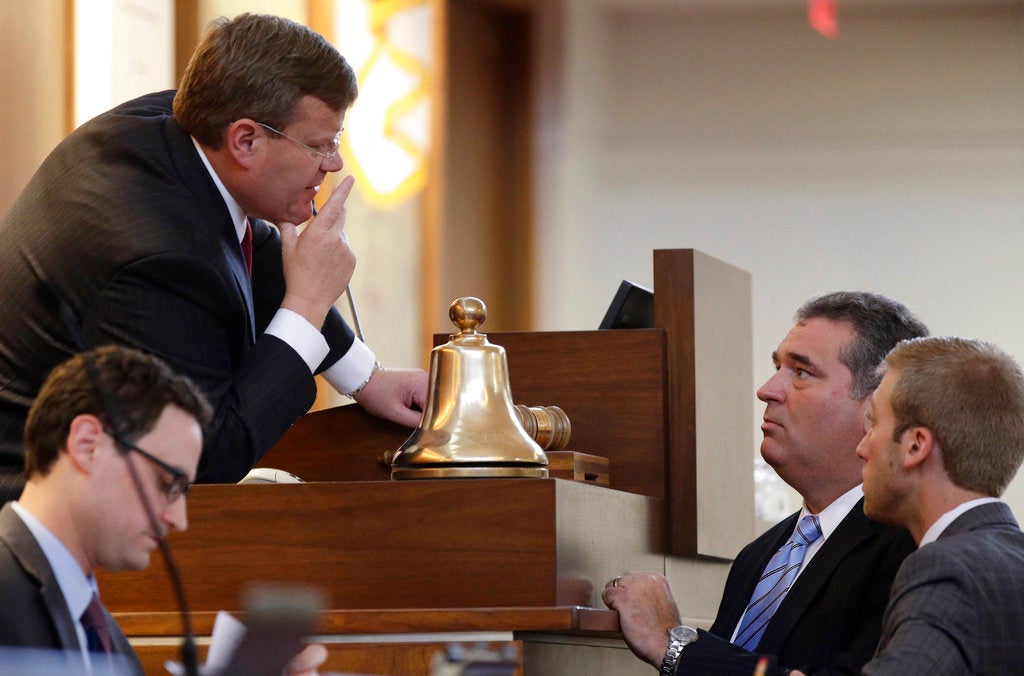
- North Carolina House Speaker Tim Moore, R-Cleveland, upper left, speaks with Rep. David Lewis, R-Harnett and aid Marl Coggins, right, during a special session at the General Assembly in Raleigh in 2018. (AP Photo/Gerry Broome)
NC Policy Watch
The source for this week’s numbers is the latest special report from the North Carolina Budget and Tax Center: “2019 Budget Fails to Effectively Address N.C.’s Existing and Emerging Needs.”
11 percent — growth in North Carolina population between 2008 to 2018
1 percent — inflation-adjusted growth in state public investments during the same 10-year period
6 percent — average total state General Fund spending as a share of the state’s economy over the past 45 years
5 percent — the amount spent in the FY 2019 General Fund budget
$881.7 million — amount in non-inflation-adjusted dollars the state budget grew between 2018 and 2019
$946.8 million — amount budget would have had to grow in order to maintain current services for the growing population, keep up with the cost of delivering services, and fulfill the obligations of policy decisions like increasing teacher pay
$24.4 billion — amount of revenue available to state lawmakers for the FY 2019 budget
$561 million — amount lawmakers simply left unappropriated
Another $221 million — amount lawmakers sent to the Savings Reserve or “Rainy Day Fund”
71 percent — amount of new state investments that are derived from non-recurring “one-time” funds that will be uncertain in years ahead
3 percent — amount of new state investments in Gov. Cooper’s proposed budget that would have been derived from one-time funds
$900 million — amount state will lose in revenue in 2019 due to cuts in personal and corporate income tax rates
$3.5 billion — annual amount by which tax cuts implemented since 2013 have reduced state revenues
$3 billion per year — amount extra North Carolina K-12 public schools would have if they were funded at the same rate at which they were funded in 1970
80 percent — Portion of state tax cuts since 2013 that have gone to the wealthiest 20 percent of taxpayers
$22,000 — annual average tax cut for the wealthiest 1 percent of North Carolinians since 2013
$226 — annual average tax cut for middle-income taxpayers (with average annual incomes of between $33,000 and $57,000) during the same period
$16 — annual average tax cut for the state’s lowest income taxpayers (with average annual incomes of less than $20,000) during the same period
Dozens — number of critical public services and structures that continue to struggle mightily with inadequate resources as a result of decisions included in the 2019 budget